Maps & Numbers Of Africa: Unpacking Agriculture
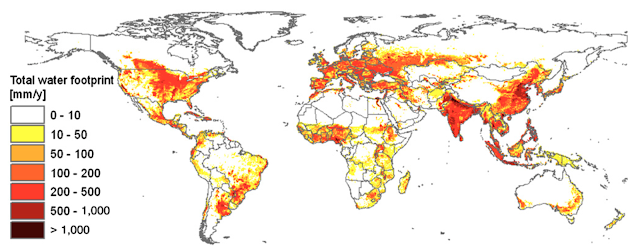
92% of global water footprint (WF) is accounted by agricultural production (Hoekstra and Mekonnen 2012). Thinking back to the citrus imported by the UK, in a way, it demonstrates how water-intensive agricultural commodity can have its water footprint externalized to South Africa or reflecting the notion that WF can be “exported”. Consequently, this affects the spatial distribution of WF which consist of blue, green and gray(pollution) WF or vice versa. Yet, Sub-Saharan Africa(SSA) has a lower water footprint of humanity (compared to Asia or India) and most countries in SSA has a lower than the world average of Blue water footprint of national consumption. In some countries, a high WF is due to meat-intensive diets (Mekonnen and Hoekstra 2012).
The water footprint of humanity in the period 1996-2005 (Hoekstra and Mekonnen 2012)
Blue water footprint of national consumption (cubic metre per year per capita)
(Hoekstra and Mekonnen 2012)
References
Damkjaer, S., & Taylor, R. (2017). The measurement of water scarcity: Defining a meaningful indicator. Ambio, 46(5), 513-531.
Mekonnen, M. M., & Hoekstra, A. Y. (2012). A global assessment of the water footprint of farm animal products. Ecosystems, 15(3), 401-415.
(Hoekstra and Mekonnen 2012)
Globally, the latitudinal variation of the ITCZ results in a seasonal and spatial distribution of rainfall in SSA (refer to Hovmöller Diagram video below) coupled with physical factors such as terrain that causes the orographic rain effect(Taylor 2004). In addition, SSA has extensive and productive groundwater aquifers due to suitable geology(Taylor 2004; MacDonald et al. 2012). Despite this, SSA only uses 3% of its renewable freshwater resources (Fischer 2007). This meant that there is a surplus in water resources available for use on the African continent.
Hovmöller Diagram: Seasonal migration of rain (Source: NOAA)
Map of groundwater storage and annual recharge (left) & Volume of groundwater storage by country (right) (MacDonald et al. 2012)
However, some countries in Africa are faced with water scarcity as defined by the Water Stress Index (WSI) (Falkenmark 1989). The WSI is calculated based on Mean Annual River Runoff (MARR) which is problematic as it masks temporal and spatial variability and does not account for “green” water, groundwater storage(mentioned above) and renewable stores. Similar quantitative measurements also undermines the multidimensional aspect to water (Hydrosocial, political, power relations, technological, access etc.). Also, a common misconception is that water scarcity is related to access to safe water which in contrary is not true (Damkjaer and Taylor, 2017). Nonetheless, WSI also anticipates food insecurity as water is key for intensive agriculture to meet demands and the numerical estimates that categorizes water scarcity(<10000m3 per capita per year) is largely about whether there is water for agriculture.
Map of water scarcity in 2010. (Source: UN WWDR)
Indeed, it is difficult to reconcile why some parts of Africa face a water crisis when there is plenty of water resources. As such, researchers have concluded that it is not a matter of quantity but a complex problem which includes uneven distribution, access, and poverty that affects the locals adaptive capacity. For example, the uneven distribution of irrigation which possibly compensates for lack of rainfall is elicited by the north-south divide where only 4% of the land is irrigated in SSA compared to northern Africa(28%) (You et al. 2011). In addition, poverty and intra-community inequality such as in Ethiopia (Tucker 2014) reflects the fundamental problem of access to water resources available. Despite these challenges, farming systems and agriculture has expanded across SSA and strong growth in agriculture is expected (OECD-FAO 2018). Remarkably, the proportion of GDP from agriculture has also increased (AGRA 2017).
Sector shares in total GDP from 1990-2015 (Source: AGRA 2017)
Farming systems of Africa (Source: IFPRI)
In conclusion, what we witness here is paradoxical. Against many limitations, there have been economic successes that make us wonder how agriculture expansion is all possible? Looking at maps and numbers alone overlooks many agricultural stories of successes and failures in SSA that could make a impact in the agrarian history of the region. In reality, such quantitative measures may serve to be political or for other agendas. While numbers indicate progress and room for improvements, media sensationalism and negative sentiments of Africa continue to persist. Thus, it is of our interest to study the reality that the agrarian community faces from a fair and unbiased perspective.
Damkjaer, S., & Taylor, R. (2017). The measurement of water scarcity: Defining a meaningful indicator. Ambio, 46(5), 513-531.
Falkenmark, M. (1989). The massive water scarcity now threatening Africa: why isn't it being addressed?. Ambio, 112-118.
Fischer, G., Tubiello, F. N., Van Velthuizen, H., & Wiberg, D. A. (2007). Climate change impacts on irrigation water requirements: effects of mitigation, 1990–2080. Technological Forecasting and Social Change, 74(7), 1083-1107.
MacDonald, A. M., Bonsor, H. C., Dochartaigh, B. É. Ó., & Taylor, R. G. (2012). Quantitative maps of groundwater resources in Africa. Environmental Research Letters, 7(2), 024009.
Mekonnen, M. M., & Hoekstra, A. Y. (2012). A global assessment of the water footprint of farm animal products. Ecosystems, 15(3), 401-415.
Taylor, R.G., 2004. Water Resources and development challenges in eastern and southern Africa . In: T. Bowyer-Bower and D. Potts (Eds.), East and Southern Africa . Regional Development Text, RGS-IBG Developing Areas Research Group, Addison-Wesley Longman (London), Chapter 7, pp. 198-228.
Tucker, J., MacDonald, A., Coulter, L., & Calow, R. C. (2014). Household water use, poverty and seasonality: Wealth effects, labour constraints, and minimal consumption in Ethiopia. Water Resources and Rural Development, 3, 27-47.
You, L., Ringler, C., Wood-Sichra, U., Robertson, R., Wood, S., Zhu, T., ... & Sun, Y. (2011). What is the irrigation potential for Africa? A combined biophysical and socioeconomic approach. Food Policy, 36(6), 770-782.


The official source for NFL news, video highlights, fantasy football, game-day coverage, schedules, stats, scores and more. Saints football
ReplyDelete